
1、 Briefly describe
The hydro meteorological observation and early warning system is an intelligent, integrated, and networked comprehensive monitoring and broadcasting system for water and rain conditions. By constructing multiple comprehensive monitoring stations for water and rainfall along rivers or reservoirs, and utilizing IoT communication technology, communication between the monitoring center and each monitoring station can be achieved. The monitoring stations send real-time data and video images to the software platform of the monitoring center, and the status and data information of each monitoring station can be viewed through the software platform. The water conservancy department broadcasts the rainwater situation to nearby villages and villagers through wireless broadcasting based on the current river or reservoir water level, precipitation, etc., and notifies villagers in advance to prepare for flood prevention information. The parameters monitored by the comprehensive monitoring station for water and rain mainly include water level and precipitation. According to different user requirements, the measurement elements can be flexibly increased or decreased, such as water quality, water flow rate, atmospheric temperature, humidity, wind speed and direction. In addition, the monitoring station is equipped with high-definition cameras that can monitor the surrounding environment in real time.
This system can be divided into two parts, the first part is the water and rain monitoring system, and the second part is the wireless broadcasting system.
2、 Water and Rain Monitoring System
The water and rain monitoring system is divided into three layers. The first layer is the monitoring system, which consists of various monitoring stations; The second layer is the communication network, which realizes the communication networking of various monitoring stations; The third layer is the monitoring center, consisting of a central station and software platform, which realizes the functions of receiving monitoring station data and displaying interfaces. The system composition is shown in the following figure.
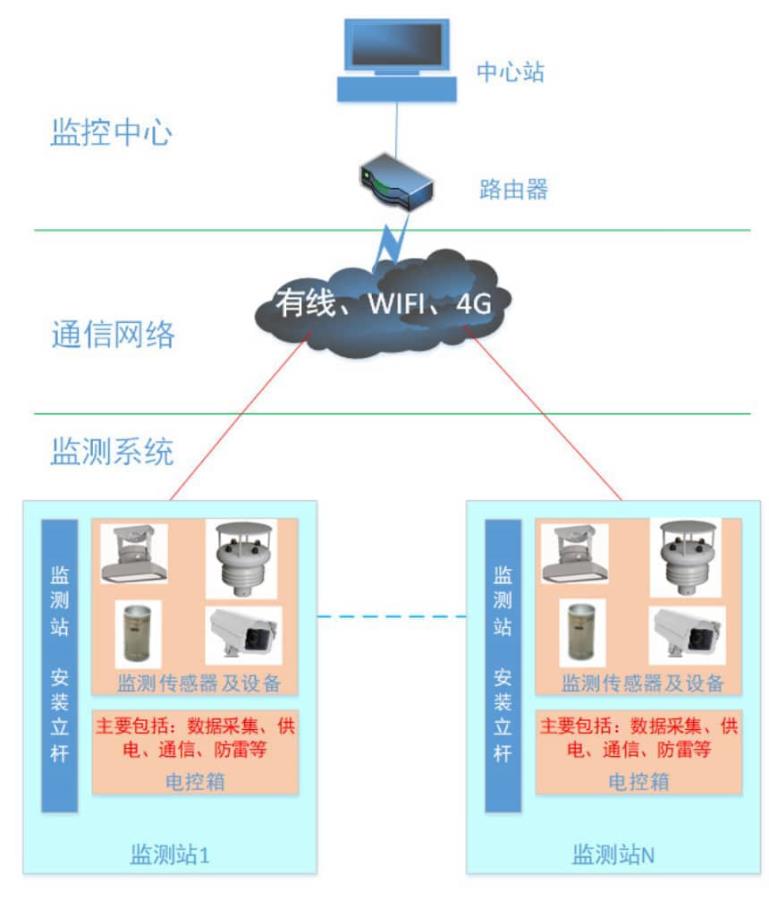
Figure 1 Schematic diagram of the composition of the comprehensive monitoring system for water and rain conditions
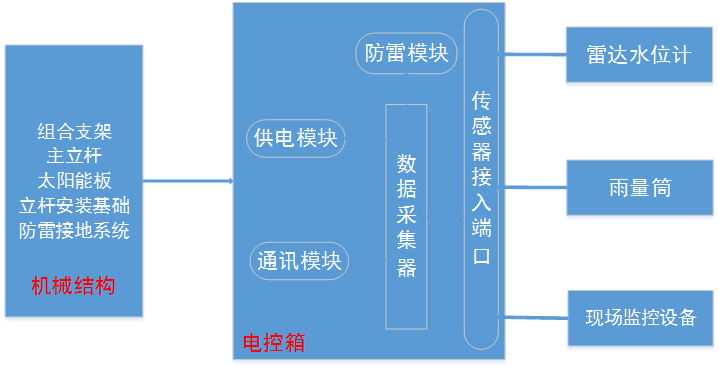
Composition of monitoring stations
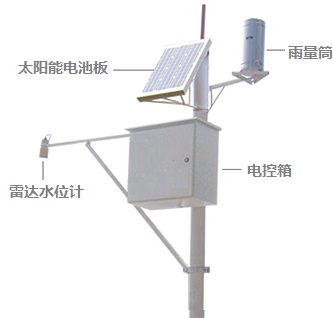
Figure 3 Schematic diagram of monitoring station structure
The sensors and equipment connected to the water and rain monitoring station mainly include radar water level gauges, rain gauges, and scene monitoring video equipment. The mechanical structure includes installation columns, solar panels, lightning protection and grounding systems, and column installation foundations.
3、 Wireless broadcasting system
The wireless broadcasting system includes a broadcasting transmission center and a broadcasting reception end. The broadcasting transmission center equipment is mainly composed of microphones, broadcasting transmitters, and transmitting antennas, while the broadcasting reception end equipment is mainly composed of broadcasting receivers, receiving antennas, and speakers.
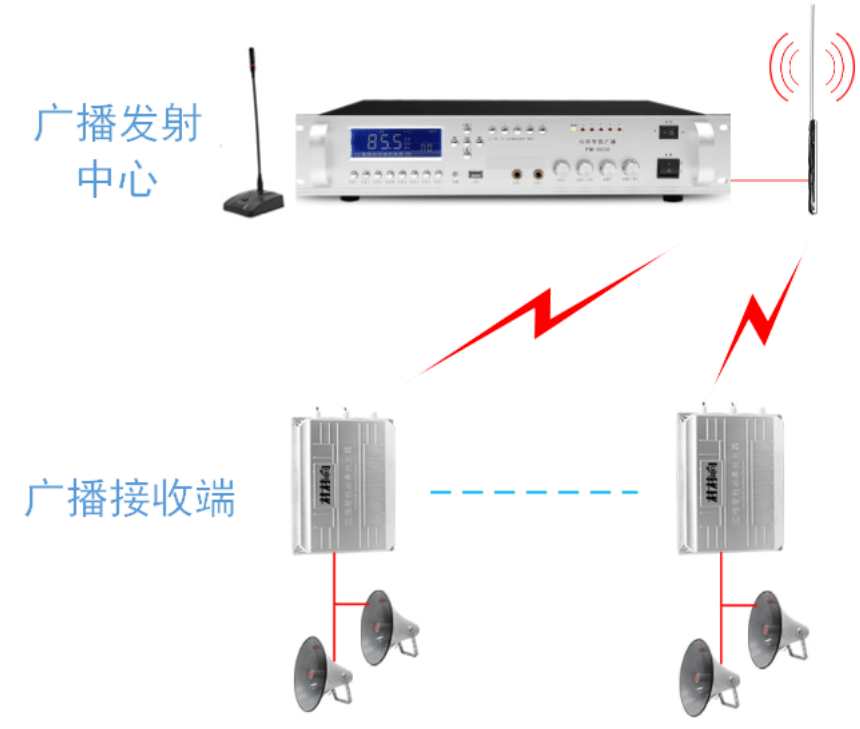
Figure 2 Composition of Wireless Broadcasting System
System features
1) Wireless transmission distance can reach over 10km;
2) Equipped with GSM mobile remote control function;
3) The transmission power reaches 100W;
4) The frequency range is 156-161MHz to eliminate radio signal interference.
4、 Software system
The software of the automatic monitoring system for water and rain conditions realizes a platform for data reception, display, alarm, analysis, and management. Management personnel use this software to monitor real-time data such as water level, rainfall, water quality, and equipment status, view on-site photos and videos, and provide assistance in comprehensively and quickly grasping the water and rain situation and making decisions.
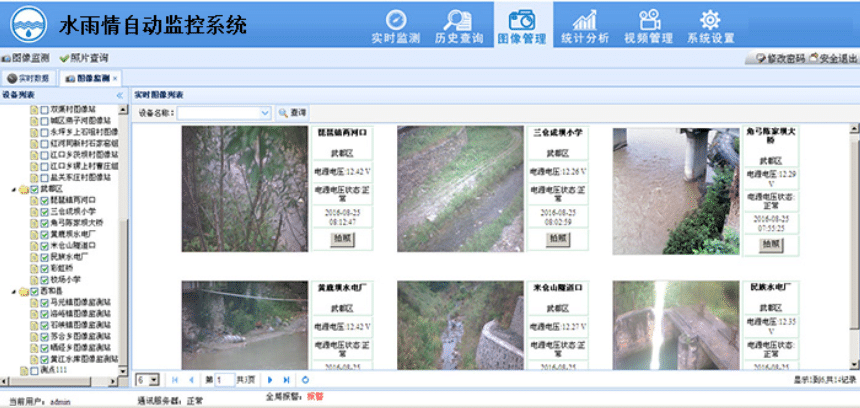
Figure 10 Software Image Display
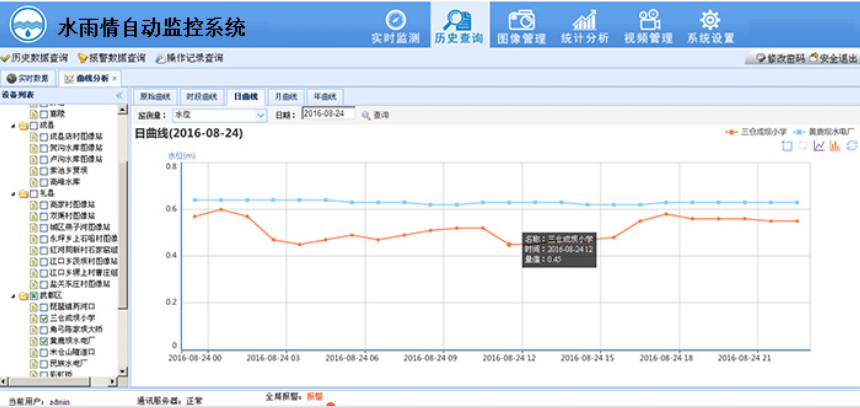
Figure 11 Historical Data Query (Curve Display)
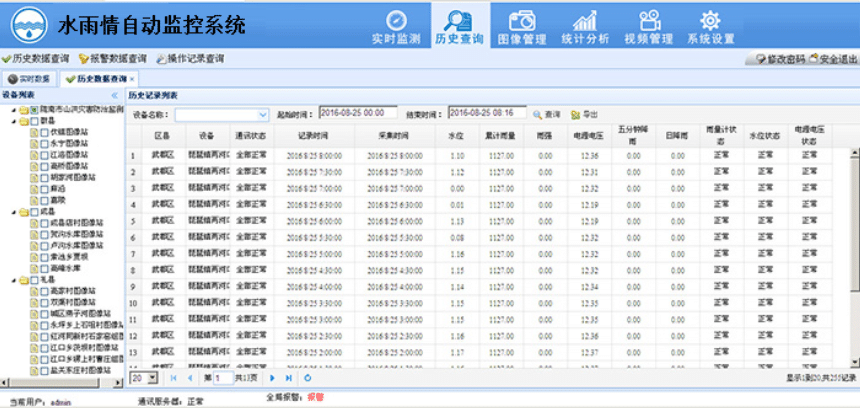
Figure 12 Historical Data Query (Data Display)
